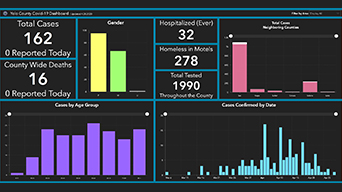
US COVID-19 applications
Applications from across the US have been collected and curated by Esri.
US COVID-19 applications
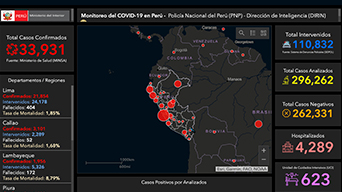
Global COVID-19 applications
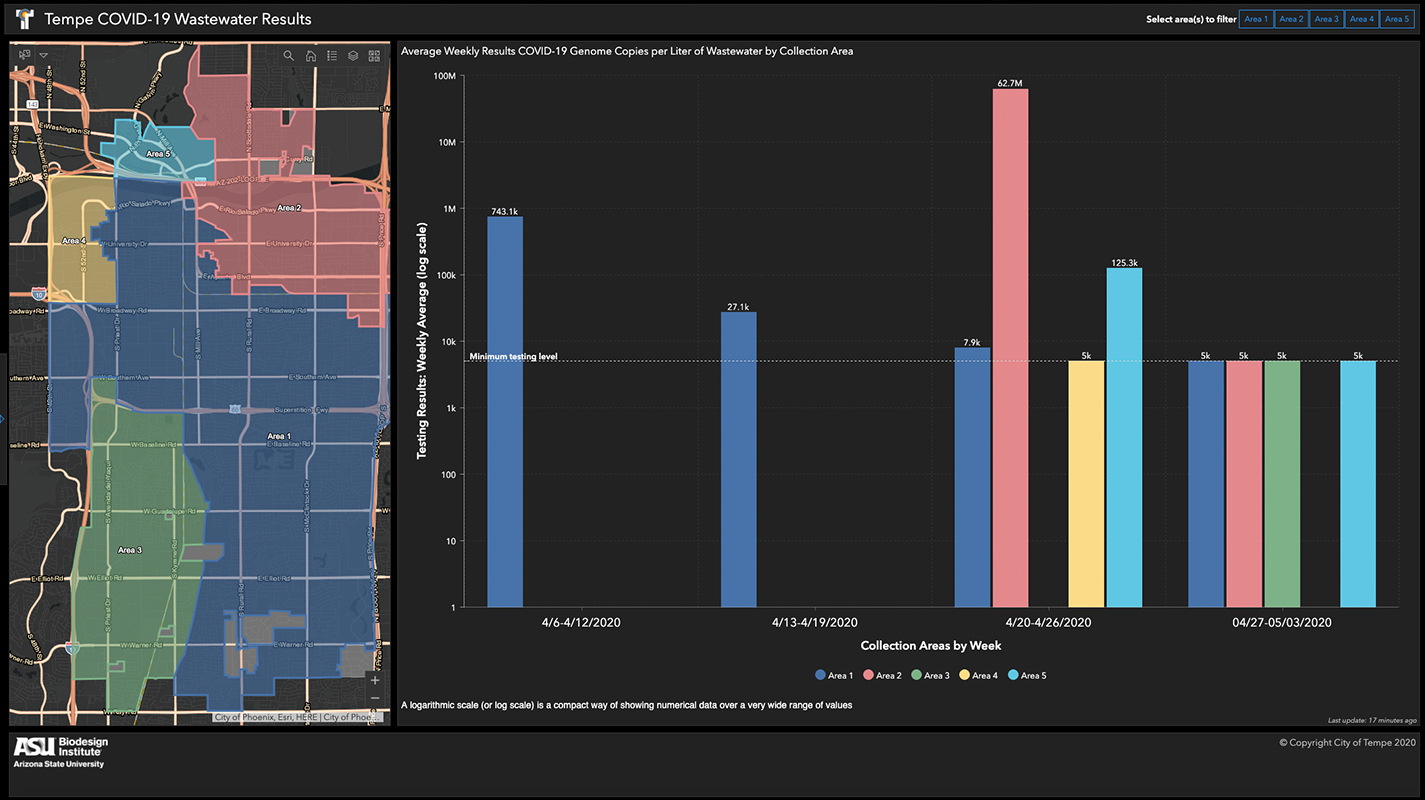
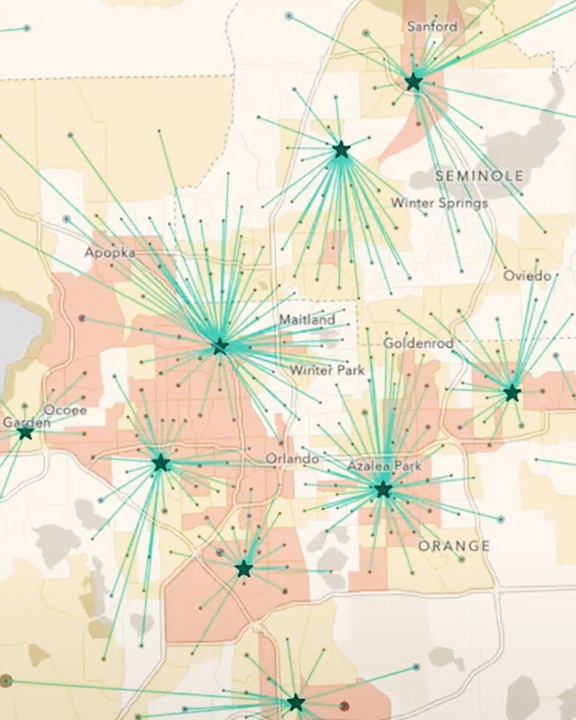
City of Tempe
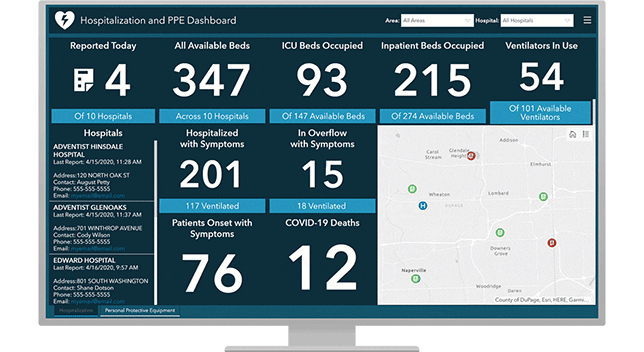
Monitor the current inventory of personal protective equipment (PPE) and the capacity and status of facilities. Map the location of these resources and their readiness to deliver critical services.
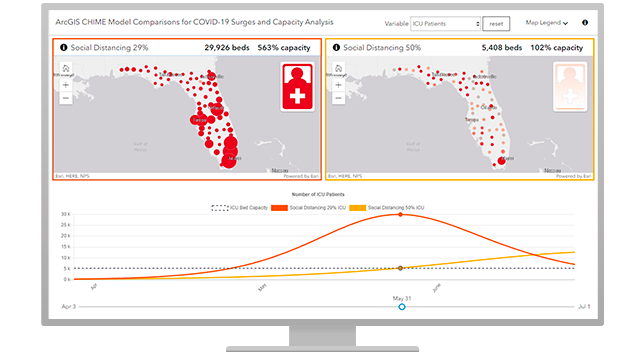
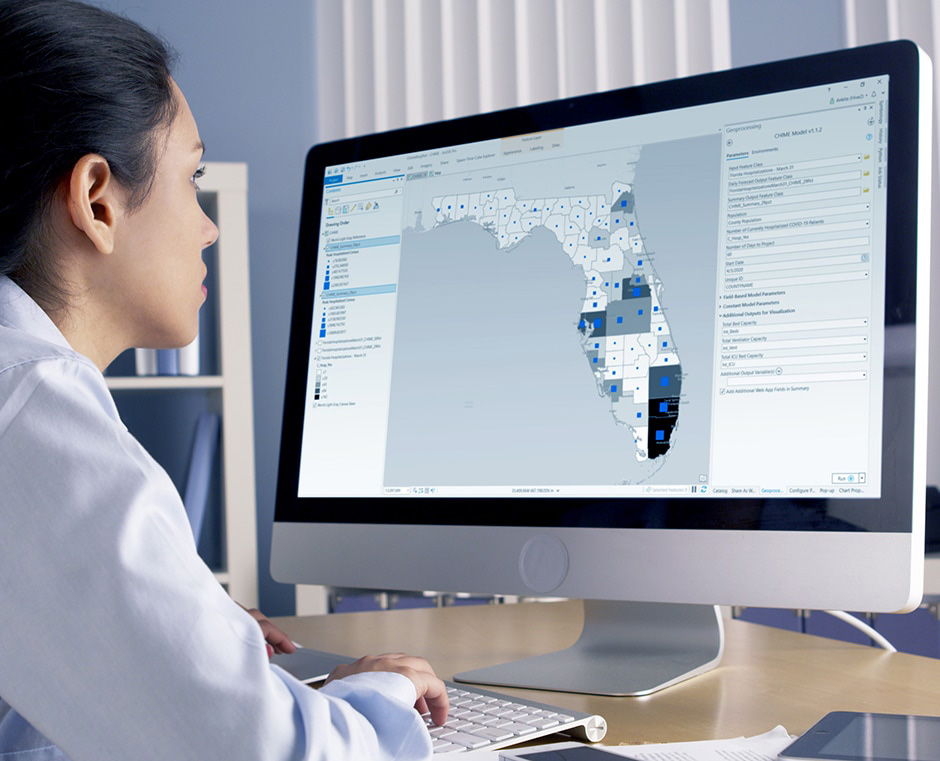
Use common public health modeling tools like the COVID-19 Hospital Impact Model for Epidemics (CHIME) and the Centers for Disease Control and Prevention's (CDC) COVID-19Surge to understand and visualize outbreaks and the potential impact on your community or organization.
Use interactive web maps, dashboard apps, and ArcGIS StoryMaps stories to help rapidly communicate your situation so everyone stays aware.
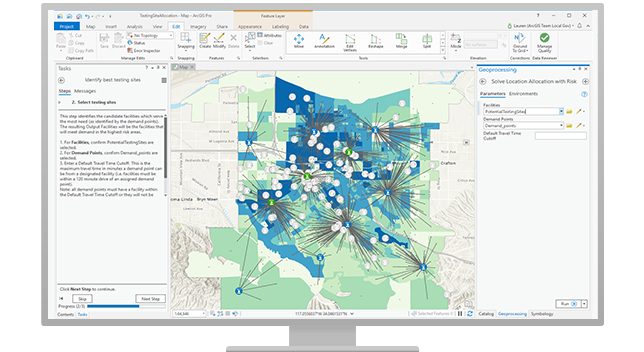
Mapping social vulnerability, age, and other factors helps identify at-risk groups and target locations for testing sites that serve the greatest need. Optimize site locations and communicate their status to the public.
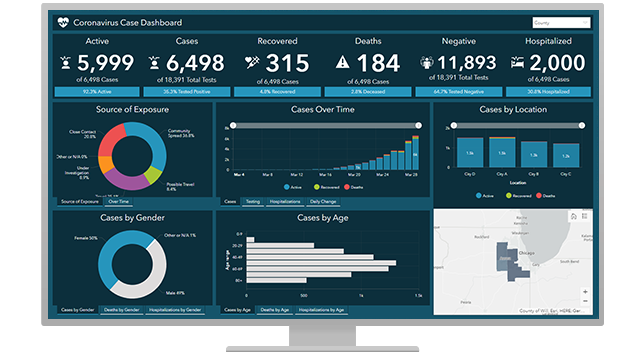
Tabulate authoritative case data and information from teams in the field. Monitor real-time trends of key health and economic indicators using dashboards for situational awareness.
GIS provides public health modeling and mapping tools for surveillance and monitoring, understanding resource capacity and needs, and improving critical communication. Maps deliver the insights needed to plan and respond in a rapidly changing environment and help slow the spread.
Observe
Collect real-time data on cases, testing sites, medical facilities, and inventory and capacity for key resources. Visualize the data with maps.
Understand
Analyze case data, bed and resource capacity, and community mobility. Identify where critical resources are needed and prioritize interventions.
Respond
Deploy resources based on real-time insights from the field, enhance critical communications, and monitor how your efforts are working.

Mapping tools for COVID-19 response
Observe, understand, and respond with location intelligence